Powering Turn Energy's 3x Utility-Scale Solar Surge and 30% Conversion Boost
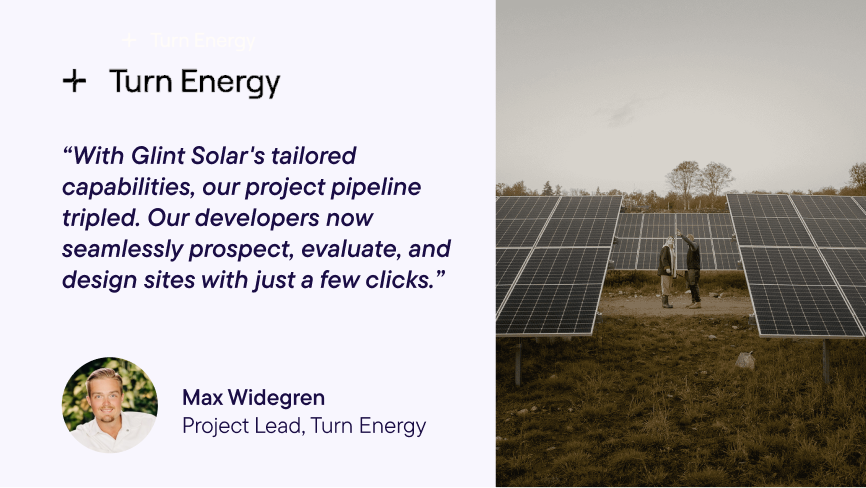
Turn Energy is a Swedish IPP building toward 1.5 GW of commissioned solar by 2028. Faced with a fragmented tool stack and late-stage risk discovery at every step of early development, they consolidated onto Glint Solar. The result: a tripled project pipeline, 20% lower development costs, and a 30% lift in project conversion rates.