Questions about Glint Solar
What is Glint Solar?
Glint Solar is the platform for renewable energy development. US developers use it to screen land for solar, storage and hybrid projects, check what the grid can take, design preliminary layouts, prepare for county hearings and track every project from the first land search to ready-to-build. See Glint Solar for US developers.
Can Glint Solar screen a whole state for buildable solar and storage land?
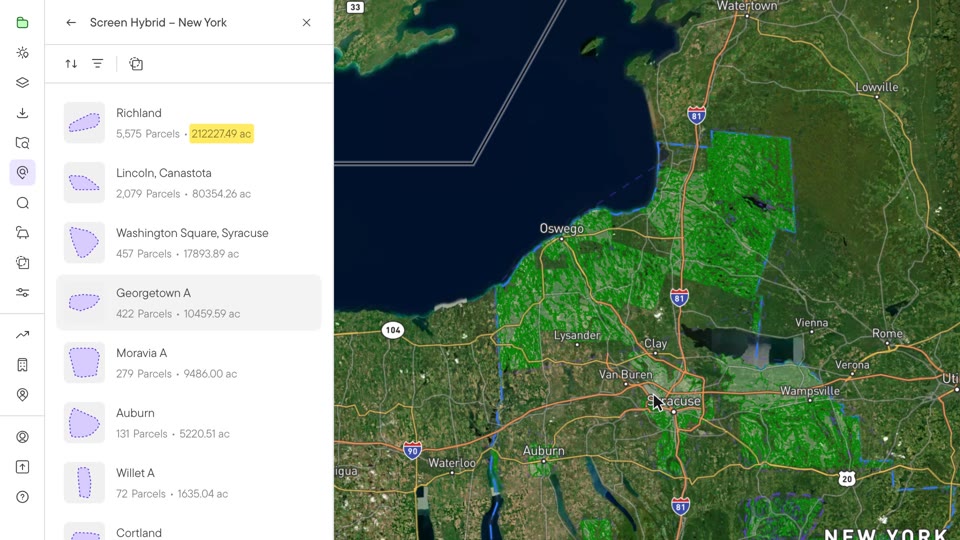
Yes. Land Screening runs your constraint profile, such as slope, parcel size and flood zones, across a whole state or region and returns opportunity areas ranked by buildable acres. Each area breaks down by parcel, with owner names, mailing addresses and land use, ready for outreach. It's available in selected states.
What US data does Glint Solar have?
Glint Solar has 75 national data layers across the US, and state sets stack on top, with the most in New York, Massachusetts, Maryland, California, Illinois, New Jersey and Pennsylvania. That includes grid data from utilities, such as National Grid's substations and how much each feeder can host.
Can Glint Solar model the revenue of a hybrid solar and storage project in US markets?
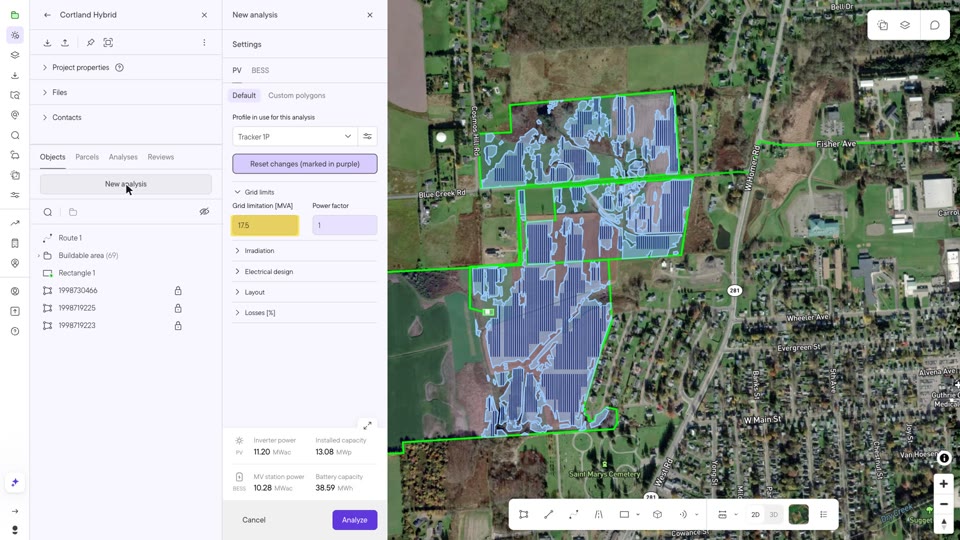
Yes. Design the PV and battery layout in Glint Solar, import day-ahead prices for your market, and the hybrid analysis shows how the battery charges when prices are low and sells when they're high, and what it adds to revenue while the site is still being chosen.
How does Glint Solar help with county hearings and community concerns?
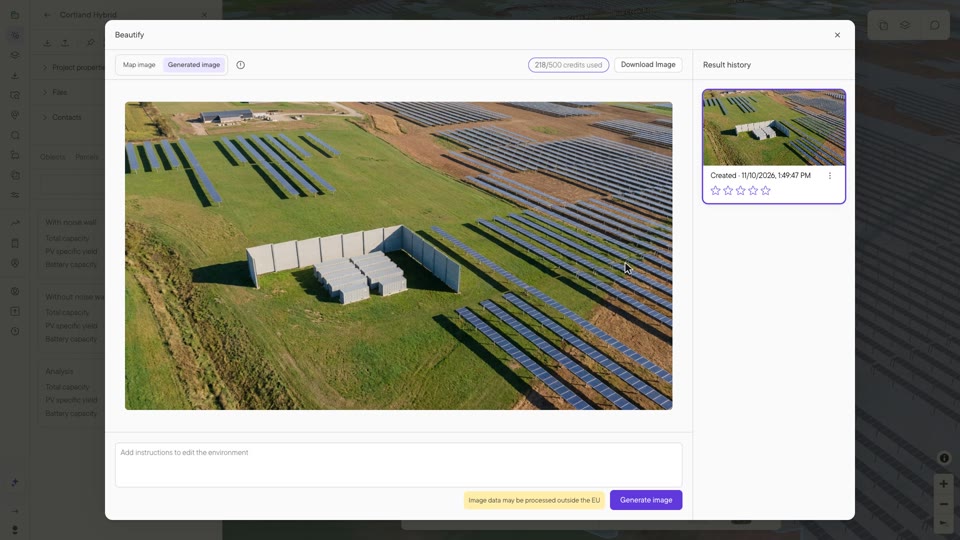
Glint Solar runs a preliminary noise model of the battery at the nearest homes, so you can test a noise wall before the hearing, and shows the project in 3D. Beautify then turns that view into realistic images for landowners, communities and county boards.
Does Glint Solar design standalone battery storage?
Yes. Glint Solar designs standalone BESS as well as solar and hybrid projects, with battery layouts built from your saved profiles and a noise model for the containers. Switch battery suppliers and the layout redraws, so you can compare options on the same site.
Does Glint Solar work with PVsyst and other tools?
Yes. Glint Solar exports shading scenes to PVsyst, panel layouts as DXF and yield data to Excel, and the Project API keeps projects, parcels and contacts in sync with your CRM or project management system.
How do teams manage their development pipeline in Glint Solar?
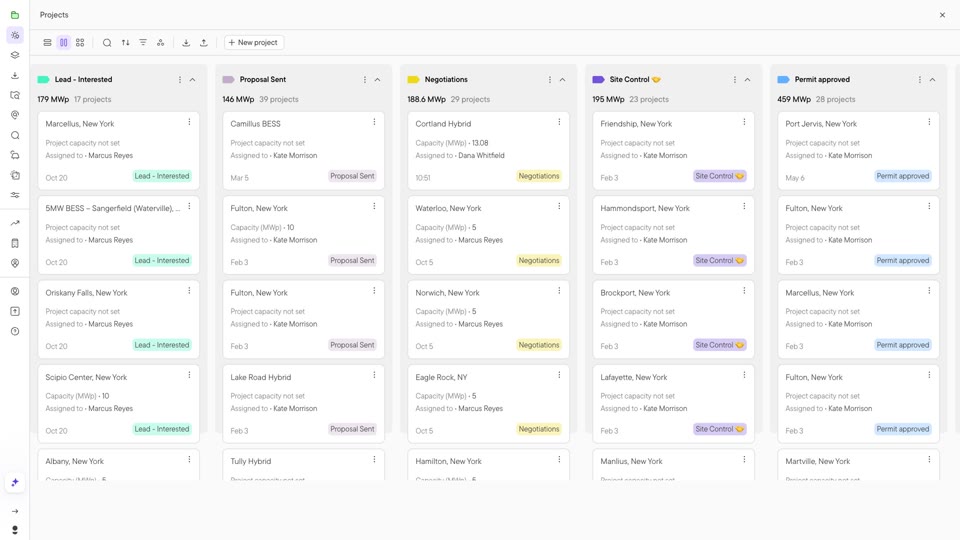
Every project sits on a board in its development stage, with its parcels, landowner contacts, comments and files attached, and Site Control tracks where each parcel stands. Dashboards turn the whole pipeline into charts for management and investors.