Published on April 15, 2026
This is where the Glint Solar Italian dataset becomes a strategic asset. Our layers are designed to support developers in every decision, transforming preliminary analysis into a rapid and efficient process.
Our data library offers immediate access to crucial information, including:
- Grid infrastructure: Power lines, primary substations, and grid connection requests.
- Territorial data: Cadastral parcels.
- Regulations and constraints: Environmental, landscape, and administrative restrictions.
- RSE Atlas integration: Clear insights into regional energy consumption and suitable areas for photovoltaic projects (ground-mounted and rooftop) and wind energy development.
Glint Solar provides a consolidated database at both national and regional levels, which already integrates provincial details in key areas, with plans to progressively extend this coverage across the entire country.
Below, you will find a brief overview of the most valuable information layers available in Italy and how they can concretely optimize your workflow.
Grid siting score - Combined (renewables + storage + demand)
The grid siting score layer summarizes, into a single classification, the information contained in the three layers dedicated to connection requests for renewable energy plants, energy storage systems, and electricity consumers. The objective is to provide an immediate assessment of the status of the National Transmission Grid (RTN) at municipal level, combining the degree of grid saturation with the presence of new electricity demand hubs.
The classification is calculated by considering only connection requests in the advanced stage of the process, as these represent the projects with the highest likelihood of being developed and effectively occupying available grid capacity. By integrating information from the three layers, the result is a synthetic indicator that allows the rapid identification of areas most suitable for the development of new projects, without the need to analyse the individual datasets separately.
The indicator is based on two main variables:
- Generation Queue (q): the sum of the power capacity (MW) in the advanced stage of connection requests related to renewable energy plants and energy storage systems. This parameter represents the pressure exerted on the available grid capacity: high values indicate a significant number of projects already in the connection queue and, consequently, a higher likelihood of congestion.
- Demand Queue (d): the sum of the power capacity (MW) in the advanced stage of connection requests from electricity consumers, including data centres. This parameter identifies the presence of new electricity demand hubs, which may represent an opportunity for the development of new projects through the possibility of locally balancing generation and consumption, reducing the impact on the grid.
The final classification results from the combination of these two indicators. The Generation Queue represents the primary evaluation criterion, dividing municipalities into increasing levels of grid congestion. Subsequently, the presence of a high Demand Queue (≥ 500 MW) improves the classification by one level, rewarding areas where strong electricity demand can support the connection of new generation projects. However, this adjustment is not applied to municipalities with a Generation Queue exceeding 500 MW, as a highly congested grid remains unsuitable for the development of additional projects.
The result is a summary map that quickly identifies the most attractive areas from a grid connection perspective, combining the level of RTN congestion with the potential capacity to absorb new electricity generation. The layer therefore enables an initial territorial assessment without the need to compare the three original datasets separately, while still allowing users to access detailed connection request data by technology and consumer type by clicking on each municipality.
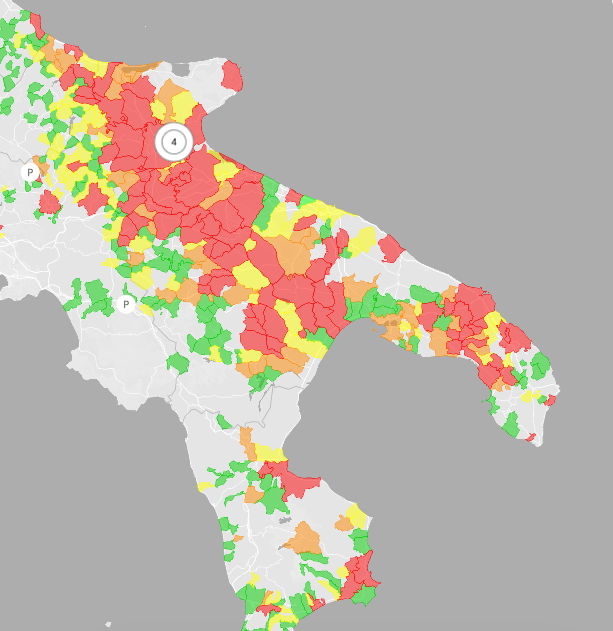
Source: Glint Solar - Layer: "Idoneità connessione alla rete - Sintesi (FER + accumuli + consumi)" (Terna S.p.A. - EConnexion)
SITAP Constraints
SITAP is the official system of the Italian Ministry of Culture that maps all areas protected for their landscape value. This dataset includes the constraints established by the Code of Cultural Heritage (Legislative Decree 42/2004), distinguishing between areas protected by law (Ope Legis) and those designated by specific administrative decrees.
This information layer allows you to immediately visualize:
- Coastal zones and water bodies: buffer zones near the sea, rivers, and lakes.
- Natural areas: woods, forests, and parks.
- Mountainous and specialized zones: mountains (above 1200/1600 meters), volcanoes, and wetlands.
Consulting this layer is essential for identifying areas that require special authorizations (landscape permits) or face specific construction limits, helping you avoid sites with high regulatory constraints.

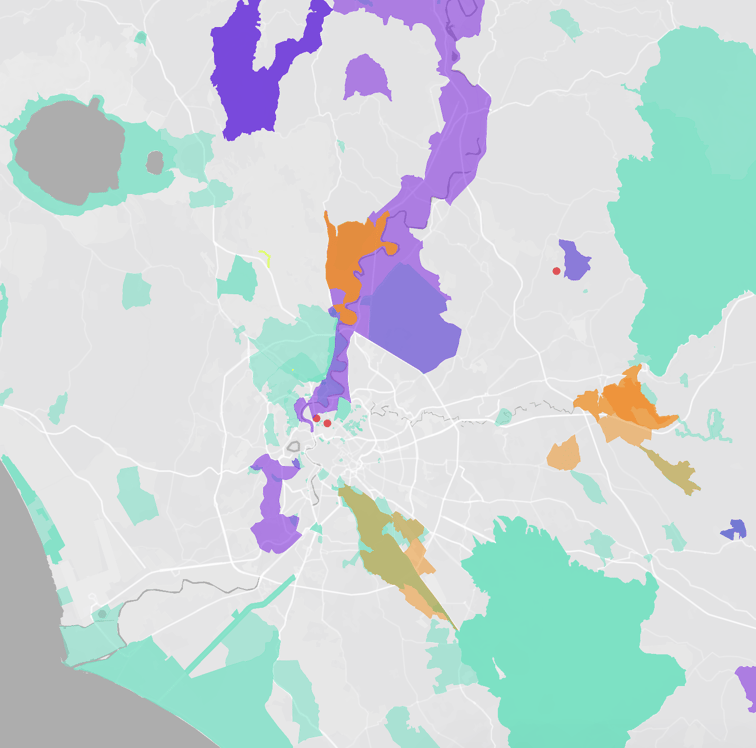
Source: Glint Solar - Layer: "SITAP: Vincoli D.Lgs. 42/2004 c.d. Ope Legis" (SITAP) and "SITAP: Vincoli D.Lgs. 42/2004 c.d. decretati" (SITAP)
Flood Hazard (ISPRA v. 5.0)
This information layer provides the ISPRA national mosaic (version 5.0 - 2020), which unifies the flood hazard datasets from the various District Basin Authorities. The mapping reflects the three probability scenarios defined by the Flood Directive (Legislative Decree 49/2010):
- P1 - Low Hazard: Rare floods or extreme event scenarios.
- P2 - Medium Hazard: Infrequent floods (return periods between 100 and 200 years).
- P3 - High Hazard: Frequent floods (return periods between 20 and 50 years).
This is an indispensable tool for immediately verifying land-use constraints and defining the design measures necessary for the safety and resilience of the plant.

Source: Glint Solar - Layer: "Pericolosità alluvioni - ISPRA 2020" (ISPRA)
Primary Substations
This layer displays the presence of primary substations (Cabine Primarie) across Italy. Primary substations are critical nodes in the national power grid: they transform electricity from high voltage (HV) to medium voltage (MV) and define conventional areas, the specific zones within which energy-sharing projects can be implemented.
The interactive map, provided by the GSE (in collaboration with grid operators), displays these areas and includes several layers related to self-consumption and energy communities:
- Conventional and Modified Areas: these delineate the specific territory served by each primary substation.
- Renewable Energy Communities (REC/CER): groups of citizens, local authorities, or businesses that share renewable energy locally.
- Collective Self-Consumers: entities (e.g., apartment buildings/condominiums) that collectively use energy produced by a shared system.
- Remote Individual Self-Consumers: a single entity consuming energy from a production plant located at a different site.
- Active Customers (Collective or Remote): users who manage production and consumption flexibly, including the provision of services to the grid.

Source: Glint Solar - Layer: "Cabine primarie" (GSE)
Cadastral Parcels
The cadastral parcels layer represents the smallest units of land division registered within the Italian Land Registry (Catasto Terreni). Each polygon corresponds to an officially georeferenced parcel, visually identified by its parcel number (particella).
Depending on the land type, the parcel number may be categorized as follows:
- Numeric: identifies standard land parcels (e.g., 123);
- "Acqua" + number: identifies water bodies or hydrographic surfaces (e.g., ACQUA45);
- "Strada" + number: identifies roadbeds and transport infrastructure (e.g., STRADA12).
Through the search function, comprehensive identification data is available for each parcel, including: surface area (in hectares), administrative references (region, province, and municipality), map sheet number (foglio), and parcel number (particella).

Source: Glint Solar - Layer: "Parcels" (Agenzia delle Entrate)
Layers built from real world use
All of our layers are built with practical application in mind. A significant portion of the data and its preparation is developed from us with a clear focus on usability, clarity, and relevance to real-world projects.
We work closely with our customers to continuously improve Glint Solar, ensuring the platform evolves according to the actual needs of renewable energy project development.
Beyond our pre-built data, you can easily import your own files, such as Shapefile, GeoJSON, KML, GeoTIFF, as custom layers or projects. With just a few clicks, you can add essential information for site selection, combine it with existing filters, and edit it securely, knowing that your imported layers remain strictly private to your organization.
If you are interested in learning more about our platform and its data, reach out to our Sales team!