One unified workspace for a single source of truth

Replace the spreadsheets, inboxes, and disconnected tools with a single source of truth, across every team, so you can compare, prioritize, and communicate your investment portfolio.

Scatec logo
Renner logo
Photosol logo
Statkraft logo
ILOS logo
Alight logo
RES logo
Total Energies logo
Scatec logo
Renner logo
Photosol logo
Statkraft logo
ILOS logo
Alight logo
RES logo
Total Energies logo

The features that bring it together.

Dashboards

See your whole pipeline by stage, region, technology, or capacity, in real time.

Explore dashboards →

Site Control

Parcels, contacts, agreements, and comments, all alongside the design they affect.

Explore Site Control →

API

Sync projects and data with Salesforce, HubSpot, and the tools you already use.

Explore the API →

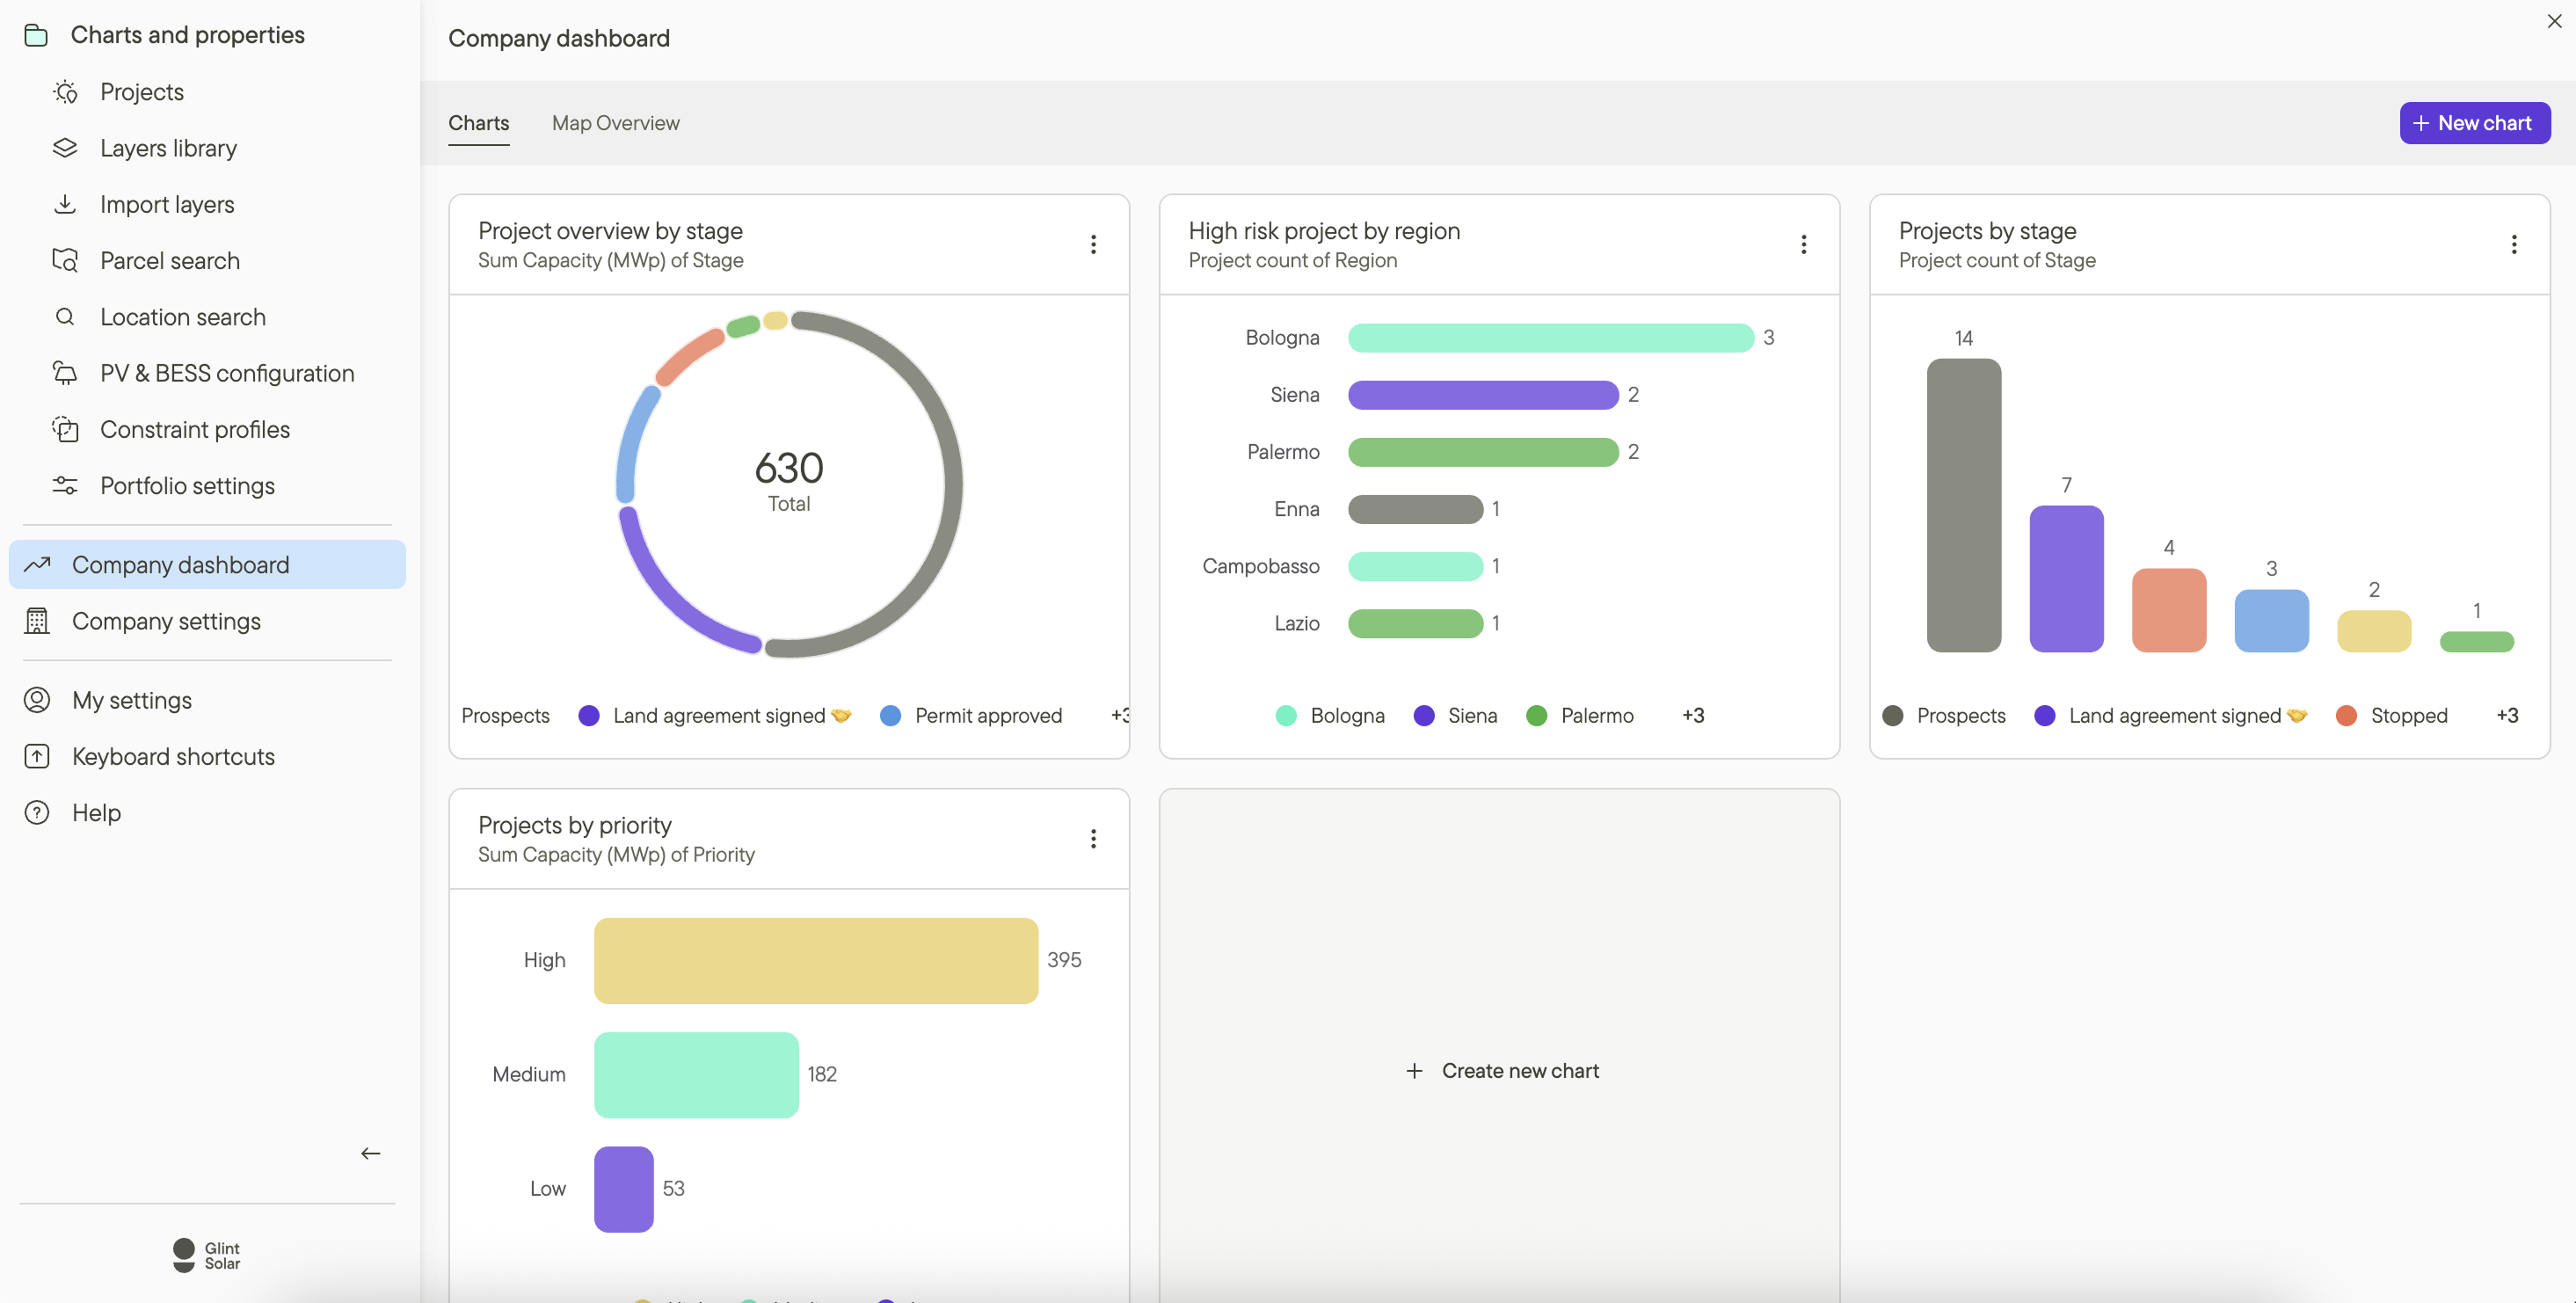
See your whole pipeline at a glance.

  • Visualize every project by stage, region, technology, or owner from the company dashboard.

  • List, board, and table views, with filters that stack on your own custom properties.

  • Track capacity by stage in MW, not just project counts.

Pipeline dashboards and charts in Glint Solar

Every project, parcel, and contact in one place.

  • Organize your PV, BESS, and hybrid projects into portfolios with the stages your team works by.

  • Site Control keeps parcel status, contacts, agreements, and comments alongside the design.

  • Reject a parcel and watch the layout and yield impact update live.

Connect Glint Solar to the tools you already use.

  • API allows you to sync projects, capacities, stages, and custom fields with your CRM or PM system.

  • Works with Salesforce, HubSpot, Monday.com, Asana, Airtable, and custom tools.

  • Only the data you map syncs. Designs and analyses stay isolated unless you choose otherwise.

API

Frequently asked questions

Does Glint Solar replace our CRM?

No. The API connects Glint Solar to the CRM you already use, so Glint becomes the map and design layer of your stack.

Can the whole team see the same project?

Yes. Projects live in shared portfolios with role-based access, so origination, engineering, and management work from one source of truth.

How do I report on the pipeline?

Dashboards visualize projects by stage, region, technology, or capacity, with filters on your own custom properties.

BOOK A DEMO

See it all in one unified workspace.

Bring your pipeline. We'll show you how project data, land control, and reporting stay connected in Glint Solar.

mountain_help_illustration_transparent