Earlier I wrote about how the market is changing for developers all over the world: the winning strategy is shifting from first-come-first-served to grid-serve.
Good news for Italy! Regulators with foresight have implemented most of the mechanisms the rest of Europe is scrambling to get going:
- Zonal prices across 7 different zones have been in place since the 2000s.
- Connection requests are public through the Econnextion registry.
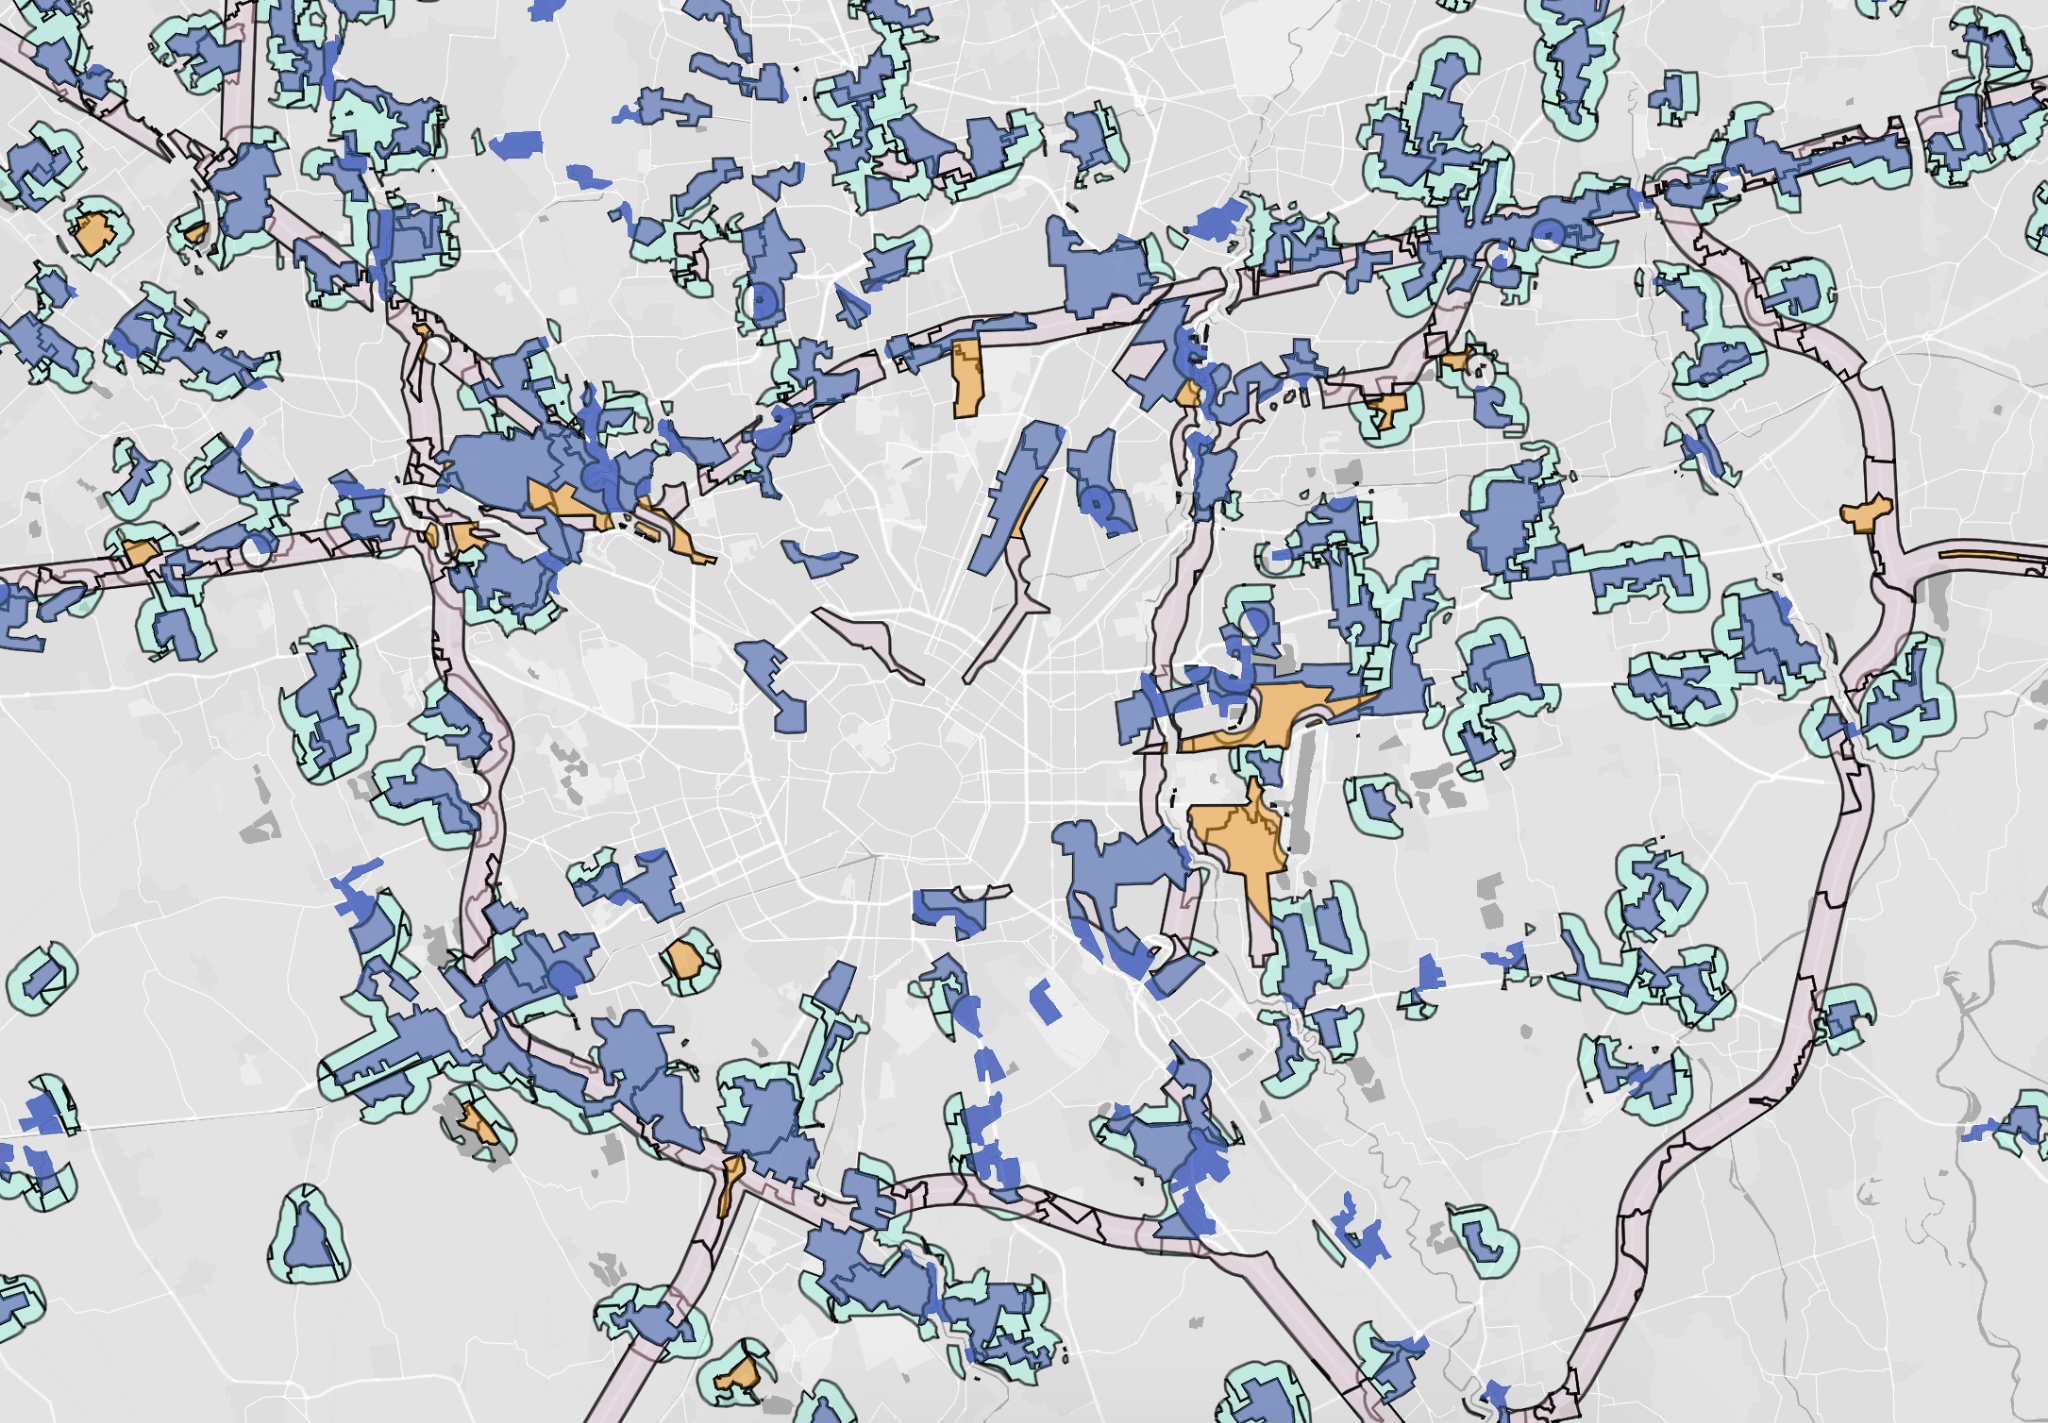
- Suitable-area ("aree idonee") rules are in place.
- Terna, the TSO, contracts battery storage by location.
Textbook market design!
And it seems to be working: Italy's solar capture rate is the highest in Europe (around 82% in 2025) meaning solar here still earns close to the average power price, where the comparable number in Spain has collapsed. Italy hasn't logged a single negative-price hour in 2023 to 2025, while Spain has already had plenty.
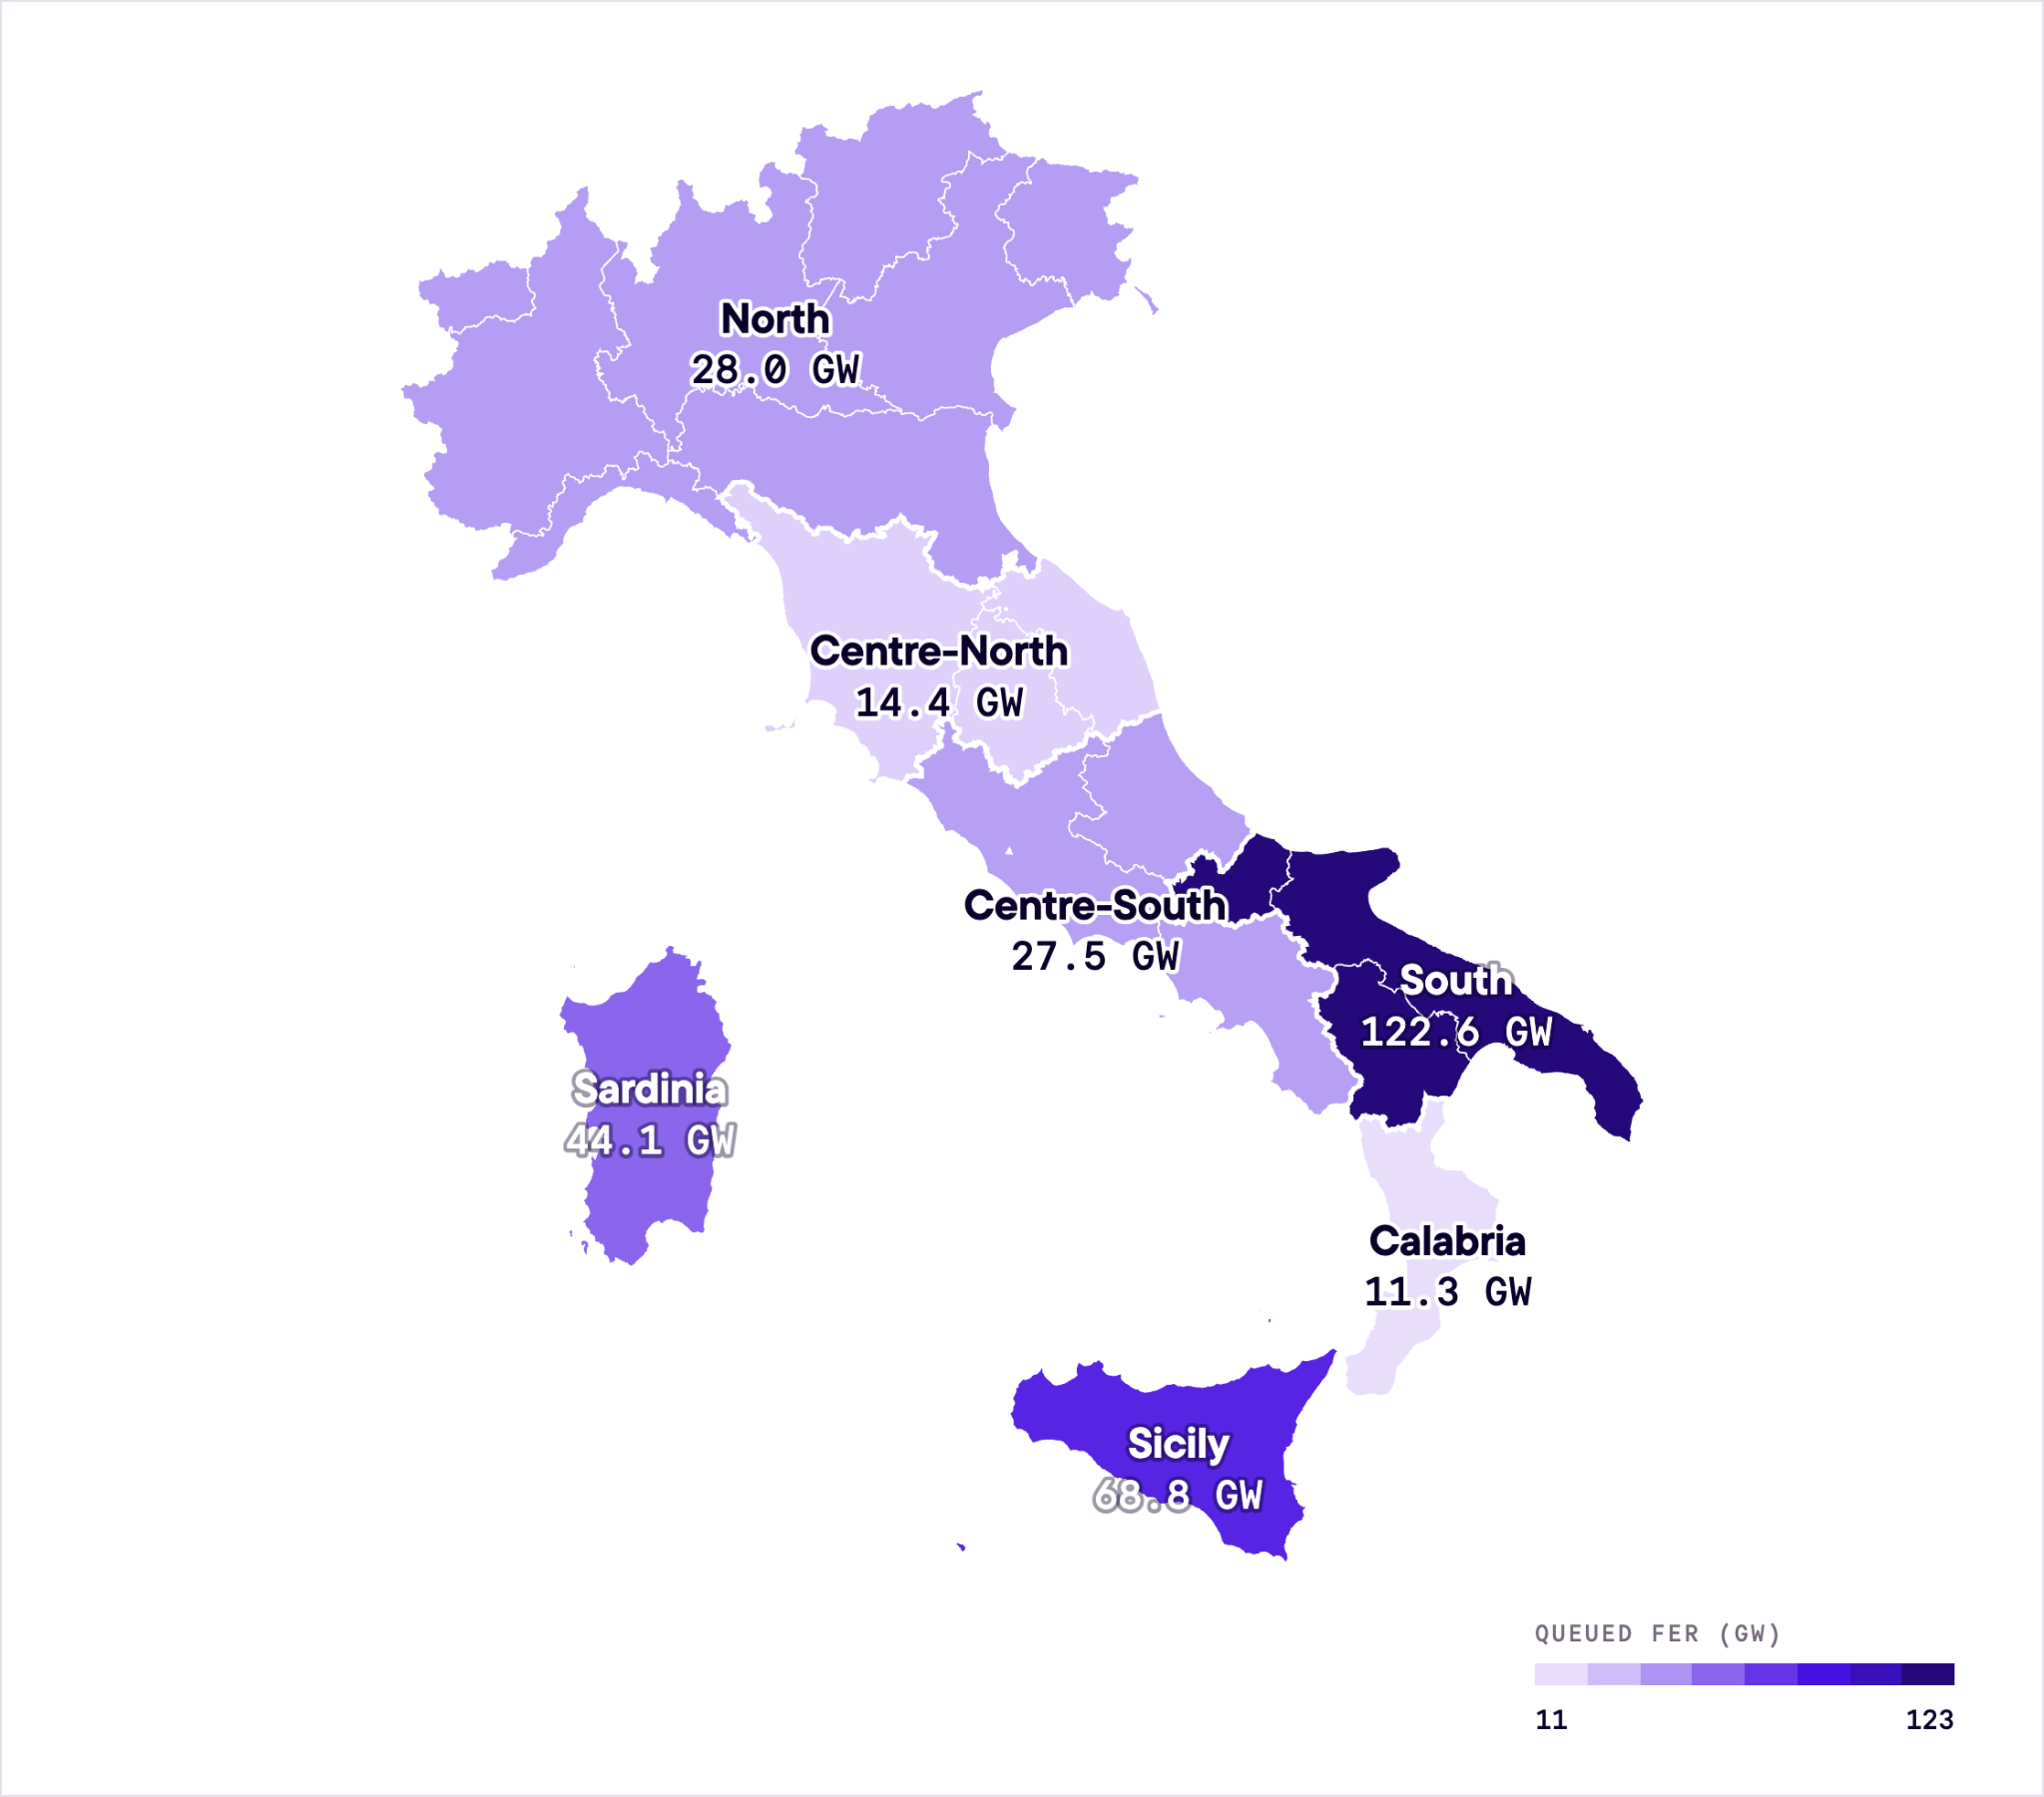
The grid queue is gigantic too: as of 30th June 2026, 316.6 GW of renewables are waiting for connection, more than 5 times the national 2030 target.
So everything's great. Sì? Not quite...
The queue is in bad shape
The queue is gigantic, yes, but it's not in good shape.
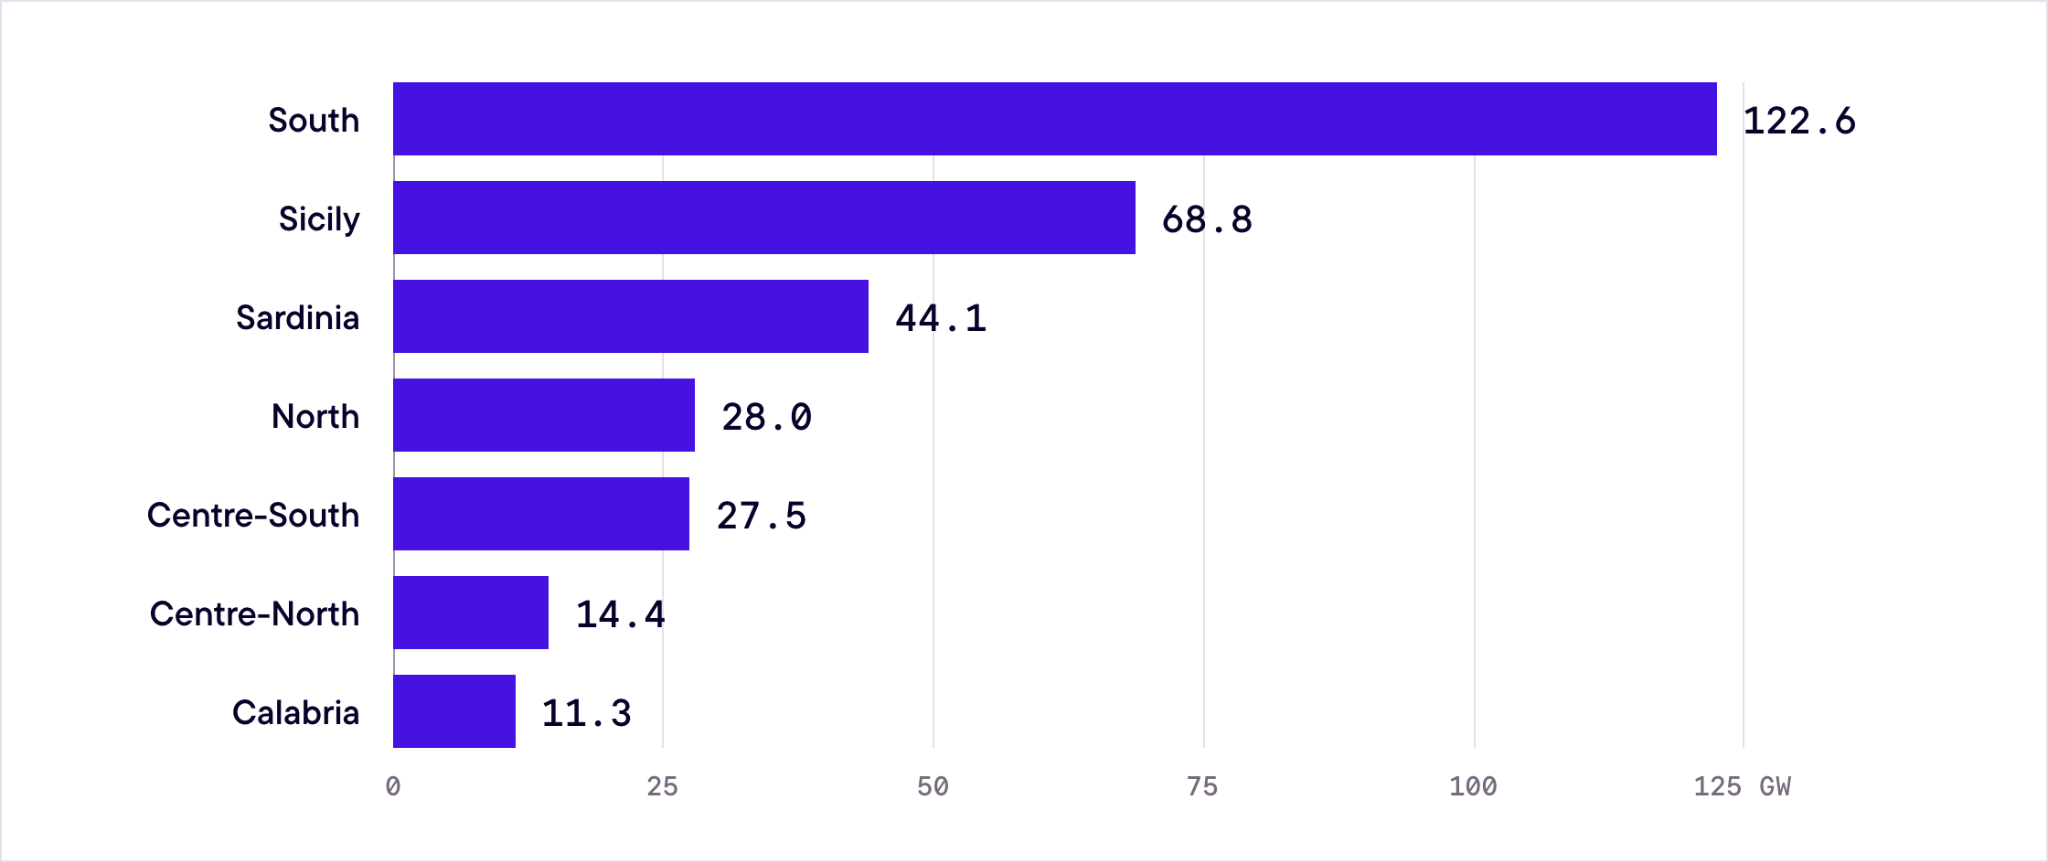
Firstly, it's full of speculative projects, especially in the south, where land is cheap and the sun shines brightly. Why? The preliminary connection request (STMG) is cheap to get, so the register measures land-optioning, not real projects. 74% of the renewable queue sits in just three southern or island zones: the South (SUD) 122.6 GW, Sicily 68.8 GW, Sardinia 44.1 GW. Only about 4% of the queue (12.6 GW) has reached a firm connection contract.
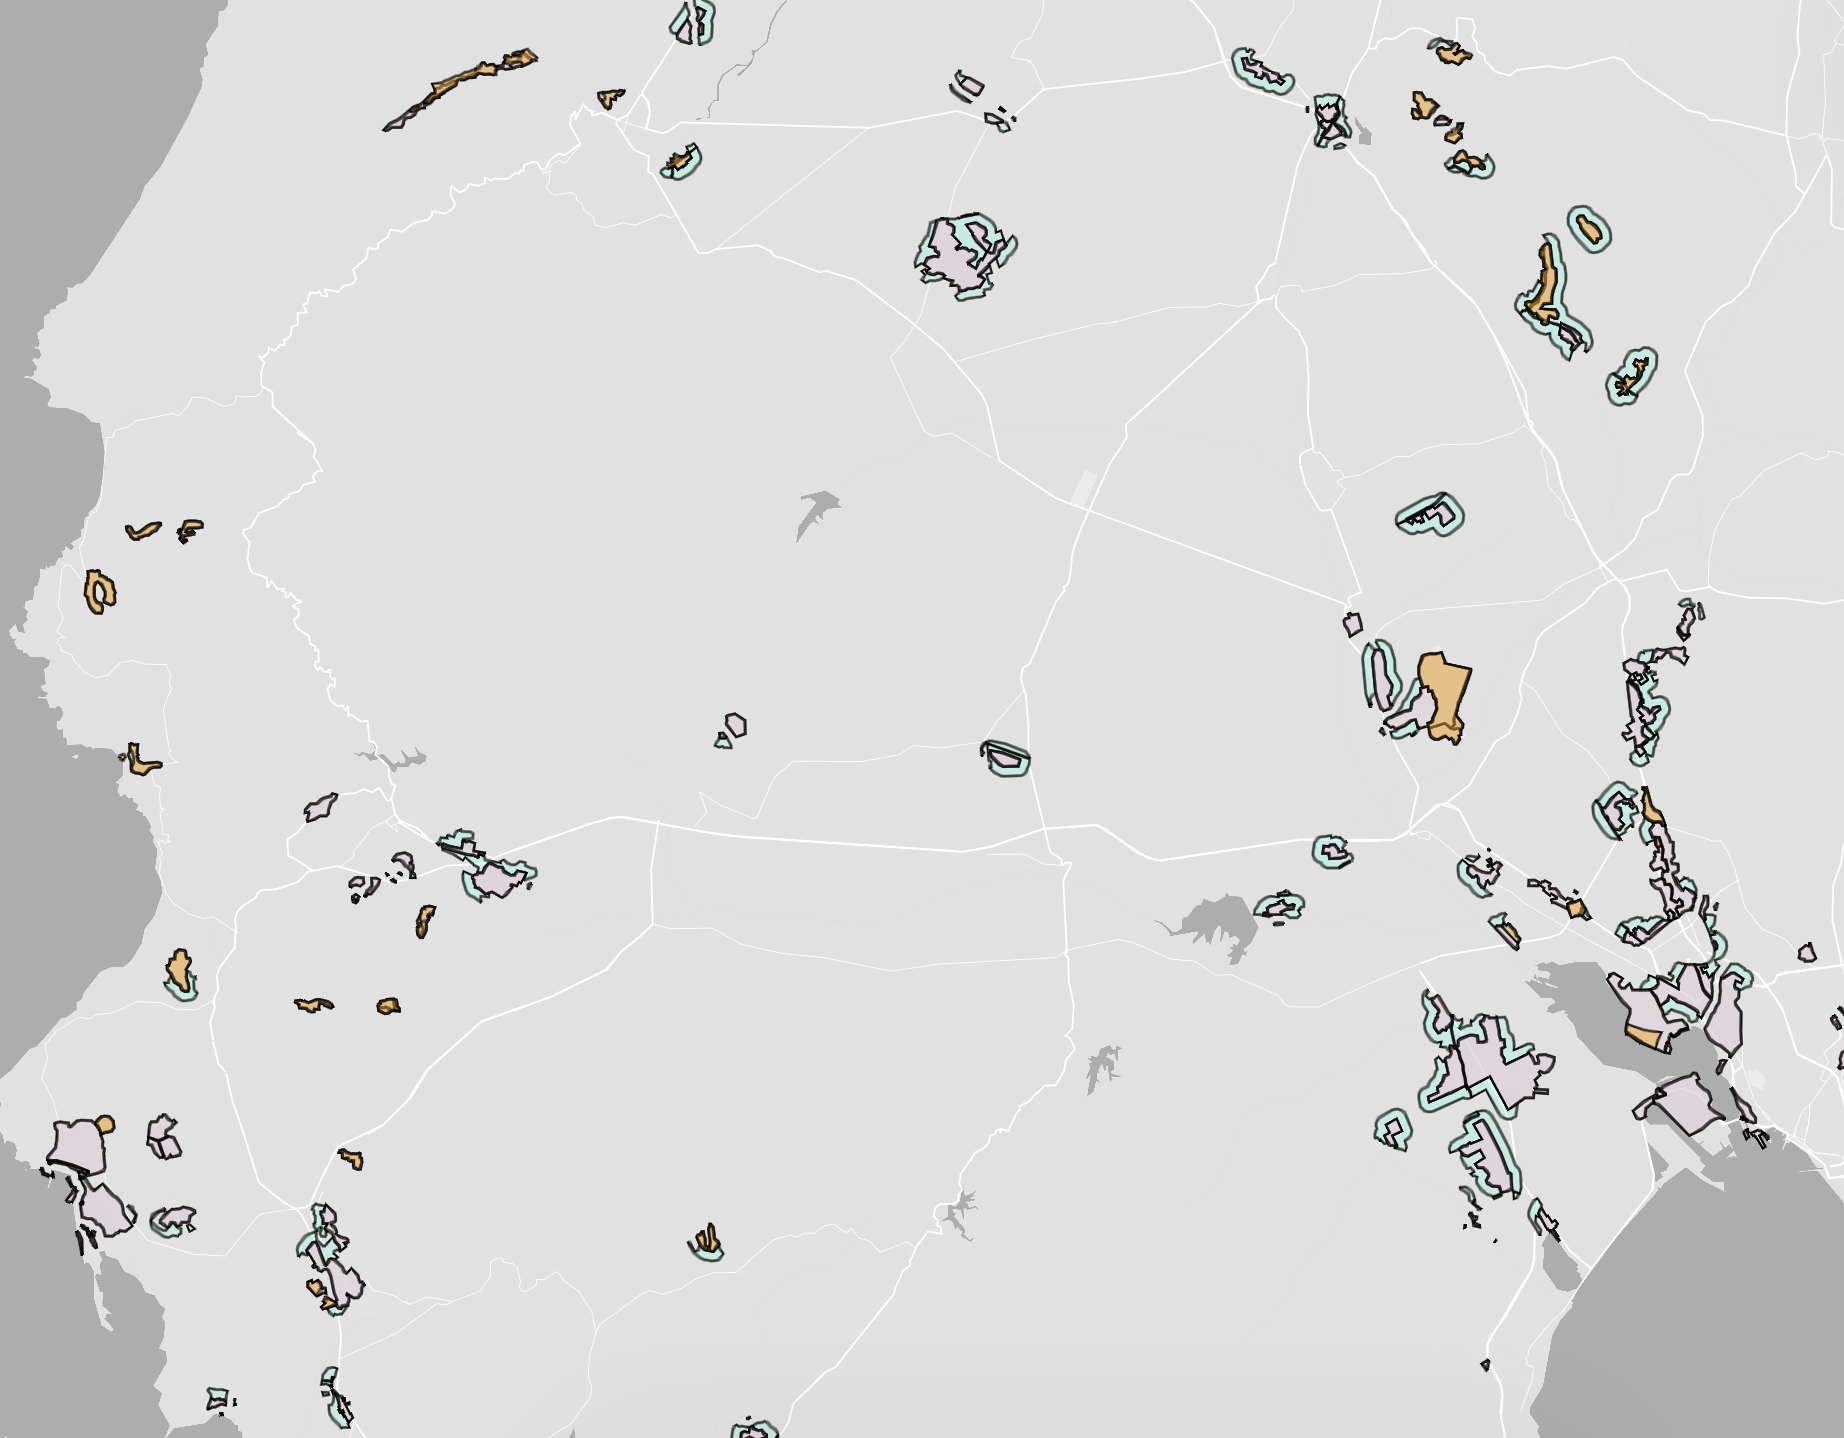
The part of the queue that isn't speculative is mostly stuck. Permitting in Italy is brutally difficult. The suitable-area (aree idonee) framework pushed siting down to the regions, forcing developers through endless legal fights before the pile drivers show up on site.
Getting grid capacity is a challenge too. The less-industrialised south sits far from the power-hungry factories of the north. So developers must clear two difficult, different filters: land permits and grid capacity, to reach a good site. In the south, what comes through is a trickle.
High capture rates are temporary
The permitting troubles are the real reason capture rates are so good in Italy.
Permitting difficulties have kept the buildout slow. There's still so little PV that gas sets the price in the middle of the day. So the PV that has been built earns near the full price of power. The permitting trickle accidentally protected the economics of Italy's first PV plants.
That can't last. Once the legal fights over aree idonee settle and the viable part of the queue becomes power-producing plants, the middle of the day will overflow with solar kilowatt-hours and destroy capture rates.
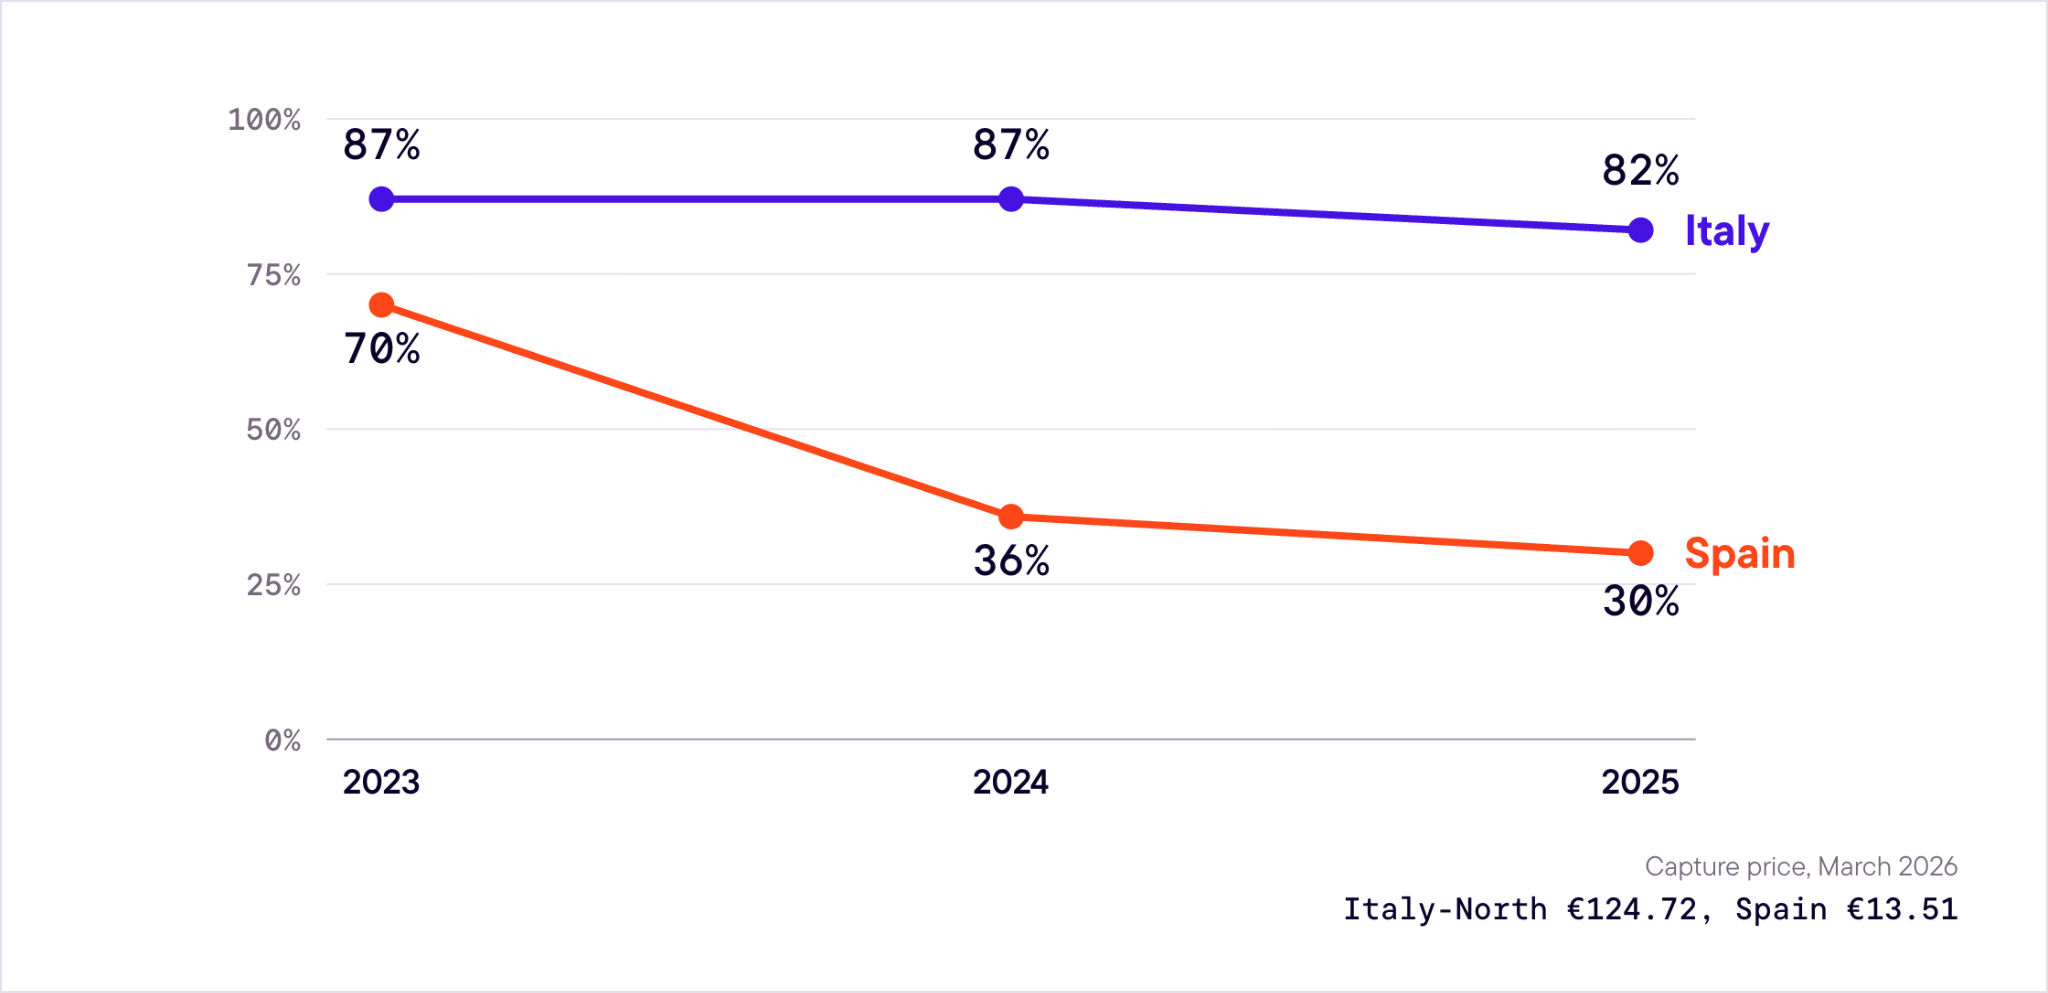
We've seen this movie before: Spain's solar capture rate fell from around 70% in 2023 to 36% in 2024 and 30% in 2025, after adding 10 GW of solar in just 18 months (Pexapark / S&P Global / Bruegel EU Renewables Value Tracker). By March 2026 the divergence was stark. A new plant in Italy-North captured €124.72/MWh that month; in Spain, €13.51.
Italy's own trajectory is starting to follow the same script: the national capture rate held at about 87% in 2023–24, then slipped to 82% in 2025 (Glint/ENTSO-E). The plot is thickening, with Sardinia already down to 77%, and falling fastest. The sites locked in now will likely bank the last good capture years in the south.
Go north
But there's a silver lining. For years, every developer has looked south for the bulk of their projects. It's time to look north, to Italy's industrial heartland.
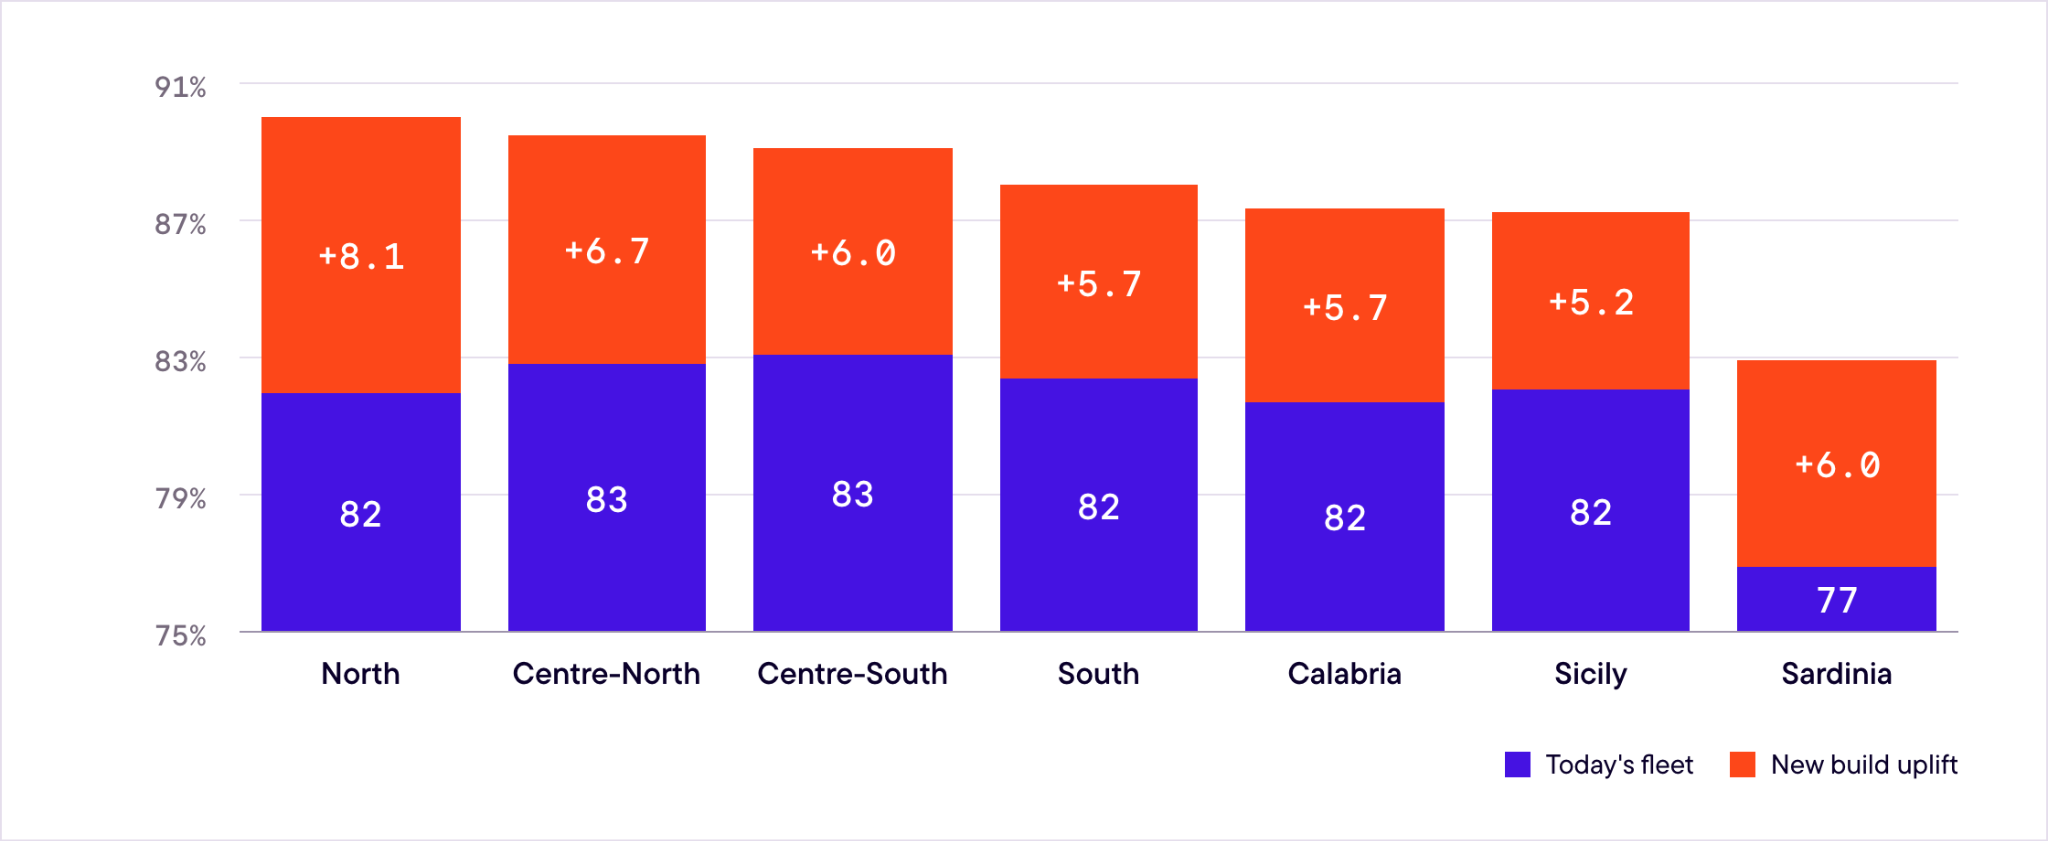
With modern plant design (single-axis tracking) a new plant will actually capture the most in the north. Because a tracking plant spreads its output into the morning and evening, it dodges the midday price crash and earns more per MWh. Per zone: North 90%, Centre-North and Centre-South 89%, versus Sardinia's 83% (Glint/ENTSO-E). Today's fleet capture is near-uniform (~82% everywhere), but a modern plant sited north earns the highest capture in the country.
The north actually needs the power: 96 GW of data-centre load is queued, 47 GW of it in Lombardia alone. Demand heads north while generation keeps heading south.
The sun shines on northern Italy too: 1,605 full-load hours in the north versus 1,760 in Puglia and 1,865 in Sicily, only 10–15% less sun.
Italian developers: why don't you look north? Probably because good, buildable land is harder to find in the densely populated, mountainous north. The south is quick to screen; the north is not.
This is the problem we solve at Glint Solar. Developers use us to screen thousands of sites in minutes and find every fleck of gold in the stream.
To wrap up
Italy's great PV capture rates have been protected by a queue that isn't as good as it looks. When the queue finally progresses, the economics in the south will worsen. In the north, the grid needs the added power, and capture rates are likely to stay high for longer. That's where the smart money goes.
Tomorrow's winners are the ones who can find suitable land where the good prices will be, before capture rates collapse in the south.
Want in?
We're building tools to make grid value visible early, to help you pick the right projects before land is secured and the application is filed. If you want to follow what we're building in this space, and be part of a group of people who care about how our grid actually gets used, subscribe here.
Data: Terna Econnextion (queue, 30 Jun 2026); Glint's own capture calculation from ENTSO-E Transparency day-ahead prices × zonal solar generation and PVGIS tracking profiles (2023–25). Spain figures via Pexapark, S&P Global, Kpler and the Bruegel EU Renewables Value Tracker. New-build capture assumes single-axis tracking, the standard for new Italian utility PV.